Table of Contents
Summary
The Agent Leaderboard is a reporting dashboard in Sierra CRM that tracks and compares agent activity across your team. It measures manual outreach (calls, texts, emails), lead assignments, and appointments so you can identify top performers, spot gaps, and coach with data.
⚠️ Only manual activity is tracked. Automated actions like drip campaigns and Action Plans do not appear in leaderboard metrics.
Why This Feature Matters
The Agent Leaderboard helps teams:
- Monitor agent performance on key engagement metrics
- Identify top agents by calls, texts, and emails
- Track scheduled appointments and lead assignments
- Coach underperforming agents based on real-time data
- Create a culture of accountability and recognition
By reviewing leaderboard data, you can quickly see which agents are driving appointments, closings, and conversions—and which may need coaching or support.
Step-by-Step Instructions
1. Accessing Sierra Reporting
-
Log into your Sierra CRM.
-
Click on Reporting in the navigation bar.
-
Select Sierra Reporting from the report options.

- Select the Agent Leaderboard tab
2. Understanding Metrics
The Agent Leaderboard has three types of data displays: metric cards, charts, and the activity table.
Metric Cards
Displayed at the top of the dashboard. Each card shows totals for the selected time range and compares them to the prior period:
- New Leads — Leads assigned during the selected time range
- Calls / Texts / Emails — Total volume of manual outreach activity
- Appointments Set — Total appointments scheduled via Google Calendar
Charts
Two charts visualize your top-performing agents by outreach method:
-
Top Callers – Five agents with the most manual outbound calls.
/Agent%20Leaderboard/image5.png?width=617&height=208&name=image5.png)
-
Top Texters – Five agents with the most manual outbound texts.
/Agent%20Leaderboard/image6.png?width=599&height=203&name=image6.png)
Activity by Agent Table
This table summarizes each agent’s performance in detail for the selected period:
|
Column |
Description |
|---|---|
|
Agent |
Full name of the user (includes users with assigned leads) |
|
All Leads |
Leads assigned during the selected period |
|
Emails |
Count of manual emails sent |
|
Total Inbound Calls |
Manual inbound calls received |
|
Total Outbound Calls |
Manual outbound calls made |
|
Total Inbound Texts |
Manual texts received |
|
Total Outbound Texts |
Manual texts sent |
|
Avg Call Duration |
Average call time (seconds) |
|
Avg Inbound Call Duration |
Average time of inbound calls |
|
Avg Outbound Call Duration |
Average time of outbound calls |
|
Buyer Appointments |
Buyer appointments made via Google Calendar |
|
Listing Appointments |
Listing appointments via Google Calendar |
|
Other Appointments |
Other appointments via Google Calendar |
3. Using Filters
Quick Filters
Available directly on the dashboard:
-
- Agent — Filter to a single agent (single select)
- Lead Source — Filter by lead origin (single select)
- Time Frame — Apply a preset date range (e.g., Today, This Week)
- When active, a filter icon appears on the report cards.
![]()
Detailed Filters (Controls Panel)
-
Click the Controls icon in the top-right corner of the report.
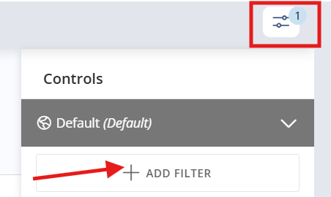
-
Click Add Filter to select custom filter fields.
/Agent%20Leaderboard/image8.png?width=234&height=422&name=image8.png)
-
Filters are grouped by type. Options adjust based on the field selected.
4. Refresh Frequency
Agent Leaderboard data refreshes every 24–48 hours, it does not display in real time.
Two fields at the top of the dashboard help you understand the state of the data:
- Data Last Updated (top-left) — Shows when the data was last refreshed (e.g., "8 hours ago")
- Date Range (top-right) — Shows the time period the data covers (e.g., "Previous Month")
Always check these fields before reviewing results or sharing data with your team.
📸 See screenshot below for visual reference:
Best Practices
- Build leaderboard review into your team cadence. Weekly check-ins on top callers and texters keep agents accountable and give you a consistent coaching touchpoint.
- Use the data in one-on-ones. Leaderboard metrics let you coach with specifics rather than general impressions.
- Pair with Smart Filters and Lead Accelerator to go deeper on lead activity alongside outreach volume. See Smart Filters and Lead Accelerator Smart Filters.
- Connect outreach to outcomes. Showing agents how call and text volume correlates to appointments and closings reinforces the behavior you want to see.
Troubleshooting Common Issues
- “My leaderboard looks outdated.” → Check the Data Last Updated field in the top-left corner. Data refreshes every 24–48 hours and will not reflect activity made in the last day or two.
- “My agent’s activity isn’t showing” → Only manual actions appear in the report. Automated activities like drip campaigns are not tracked.
- “I applied filters but the data looks wrong.” → Clear all filters and reapply one at a time to isolate the issue.
FAQs
-
Can I export leaderboard data?
Yes, leaderboard data can be exported from the reporting dashboard. -
How far back does leaderboard data go?
Data is available from the point your Sierra account was created and will display based on your selected reporting timeframe. -
Do automated emails or texts appear here?
No. Only manual outreach is tracked. Automated activity from drip campaigns and Action Plans is excluded. -
What if an agent schedules appointments outside of Google Calendar?
Those appointments won't appear in the leaderboard. Only appointments created through the Google Calendar integration are tracked. -
Who can access this dashboard?
All Sierra users.